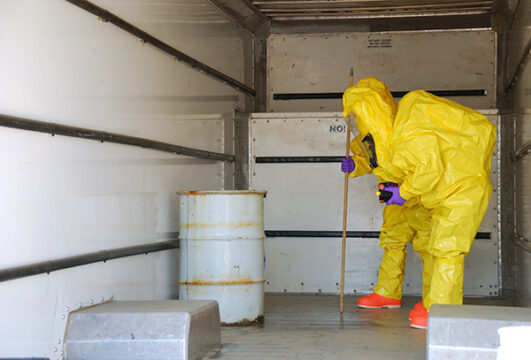
Hazmat incidents may be more common than you realize. Despite the great work by Hazmat/DG Professionals — those making sure that compliance to transport regulations are strictly followed for each shipment — incidents of all manner happen regularly.
The U.S. Department of Transportation’s Pipeline and Hazardous Materials Safety Administration (PHMSA) gathers all U.S. DG/Hazmat incident data and makes it available to the public, which is a great service that deserves the industry’s attention. Full incident data can be reviewed on PHMSA’s Incident Statistics Website.
Beyond civil penalties for improper labeling, documentation, or training, the costs to companies involved in hazmat incidents can be staggering, and have a negative impact on that company’s bottom line. Costs can include remediation of the impacted surrounding environment, restoration of property, clean up, risk to first responders and workers, and loss of the commodity (if it was on the way to a customer, your reputation with that customer may be impacted as well).
This blog post on PHMSA’s data is intended to provided a snapshot of some of the more relevant safety numbers and the types of incidents that are reported by transport mode, hazard class, commodity, state, and more. Our intent is to make this report a regular post on this blog to help identify trends.
PHMSA Report of Incidents: Q1 2020
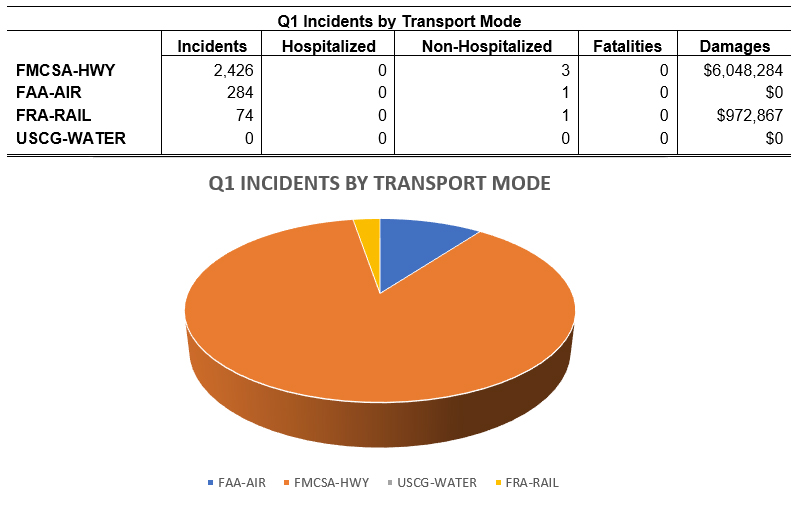
Transport Modes:
Of the four transport modes PHMSA tracks, our highways reported the most incidents (87% of all incidents) and the largest amount of damages (86% of all damages reported). That makes sense if you have ever driven on I-94 anywhere near Chicago. Between nine months of construction and wannabe NASCAR drivers, the obstacles abound compared to other transport modes:
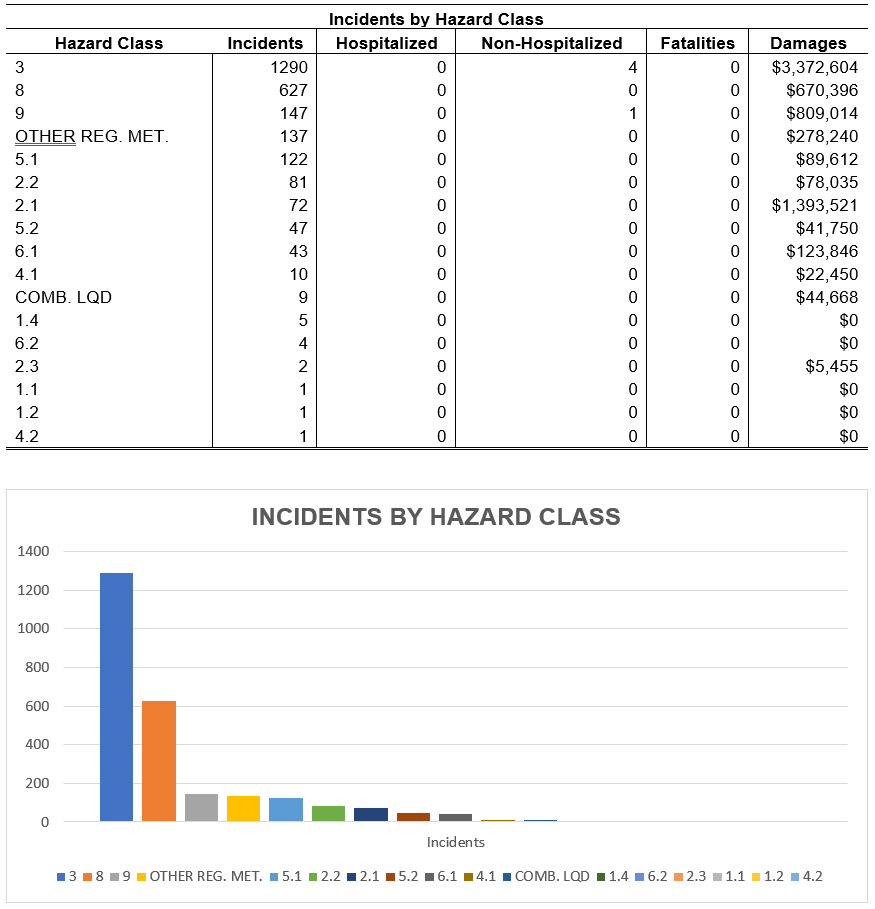
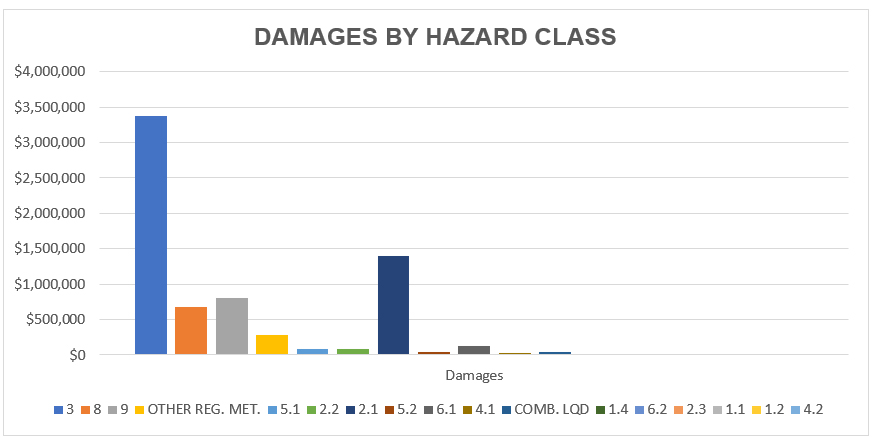
Hazard Classes:
Hazard Class 3 — Flammable Liquids were responsible for 50% of all incidents in the first quarter and 49% of all damages. While Hazard Class 2.1 – Flammable, Non-toxic Gas was responsible 3% of all incidents, it was also responsible for 20% of damages.
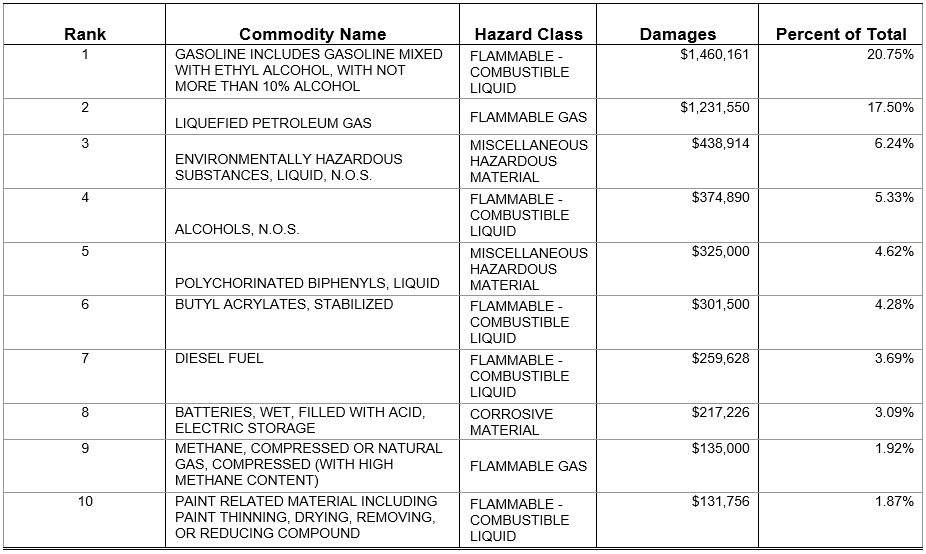
Commodities:
Hazard Class 3 – Flammable Combustible Liquids were responsible for 38% of all reported commodity damages and represent 5 of the top 10 commodity incidents in Q1. Hazard Class 2 — Flammable Gas represents an additional 21% of the total damages.
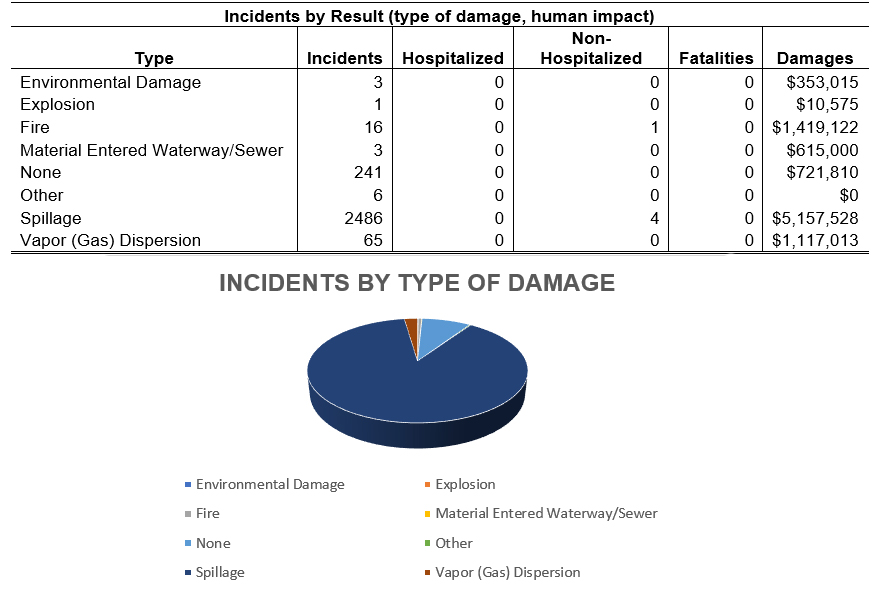
Incidents by Type and Human Impact:
55% of incidents were spills, representing 55% of all damages and 80% of all human impacts (all non-hospitalizations). While Fire represented less than 1% of all incidents, the damage those fires caused were responsible for 15% of all damages. Fortunately, no fatalities were reported in Q1, 2020!
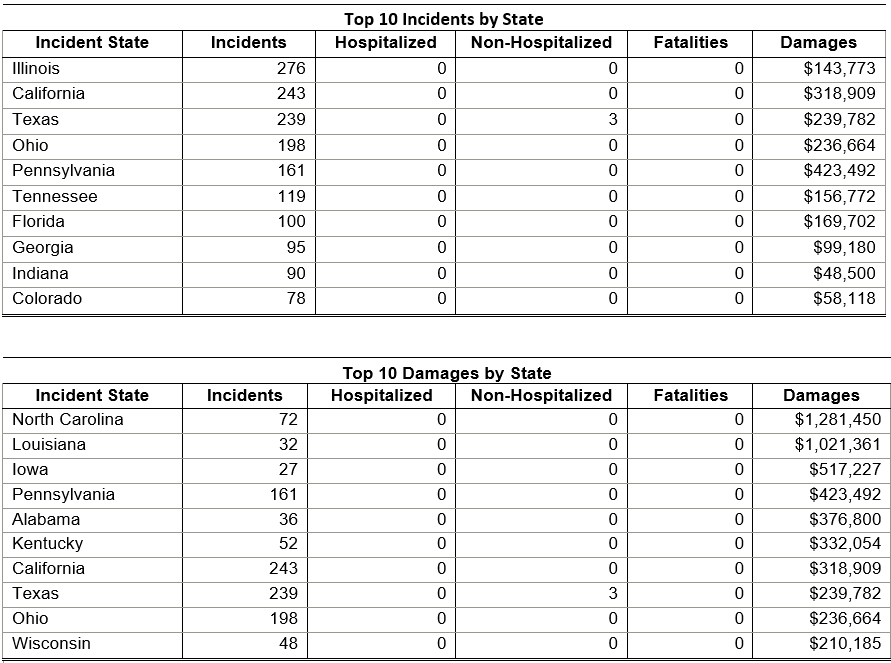
State Statistics:
Labelmaster’s home state of Illinois saw the most Incidents with 10% of the total number, but it was a different story in terms of Damages with around 2% of that total. On the other hand, North Carolina was responsible for only 3% of all incidents, but 18% of all damages. Meanwhile, Louisiana had slightly more than 1% of all incidents (32), but they caused significantly more damage than other areas with nearly 15% of all damages.
Make sure your shipments are safe and in complete compliance with a full line of solutions from Labelmaster—a full-service provider of goods and services for hazardous materials and Dangerous Goods professionals, shippers, transport operators and EH&S providers.